Offer / Filter: sample basic usage
Filter sample: will the home team finally win?
This page shows how to create and apply a simply match filter and how to check the betting strategy based on this filter.
Let's check the situation when the home team was not so successful during recent home matches. But still this team is at the top half of the league table so we could await that this team is strong enough to make a home victory now. Let's say the guest team should not be so much strong in order the home team could be taken as a favourite team despite its poor recent home results.
We must start with finding the matches which meet our criteria. Trefik provides the match filter to find the matches meeting dozens of user condititons.
The filter is at the window Offer. We can open the filter definition by the button at left bottom part of the window Offer. The window Filter contains a lot of sections with different conditions. We can go through the sections by the mouse right button menu.
Our filter will have the active conditions just at the section BALANCE and its subsections HOME TEAM TOTAL (to define the overall placement at the league table at the first half), HOME TEAM AT HOME (to define a condition for recent poor results) and AWAY TEAM TOTAL (to define a condition for the guest team explaining the guest team is not the team at a good shape):
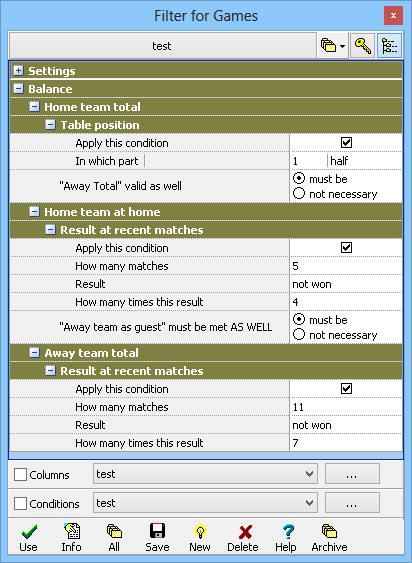
The active conditions for the filter must have checked the row "Apply this condition".
The section TABLE POSITION sets the condition for the placement of the selected team (the home team at this case) at the league table at the time before playing the match. The picture shows the setting "1st half". It is possible to set "3rd quarter" or similar values.
The section RESULT AT RECENT MATCHES contains conditions for recent matches results.
The row "How many matches" specifies how many team recent matches should be analysed. Five recent home matches will be analyzed for the home team at our sample.
The next row "Result" defines the result the filter searches for. Our sample defines the result "not won" which covers ties and lost matches.
The other row "How many times this result" defines the frequency of the chosen result during the previous matches. Our sample has the condition of 4 matches for the home team at home. It means that the filter returns jus the matches where the home team have not won 4 times from recent 5 home matches.
The filter is ready for a test now. We must activate the filter at the left bottom part of the window Offer. The selected date interval is 1st September 2013 till 10th February 2014 (see the top part of the Offer window). We wish to get just the soccer matches (see the very left top part of the window).
The next picture shows that there were 566 matches meeting the filter conditions. 300 matches won the home team, 133 ties and 132 won the guest team (one match was postponed) - see the bottom part:
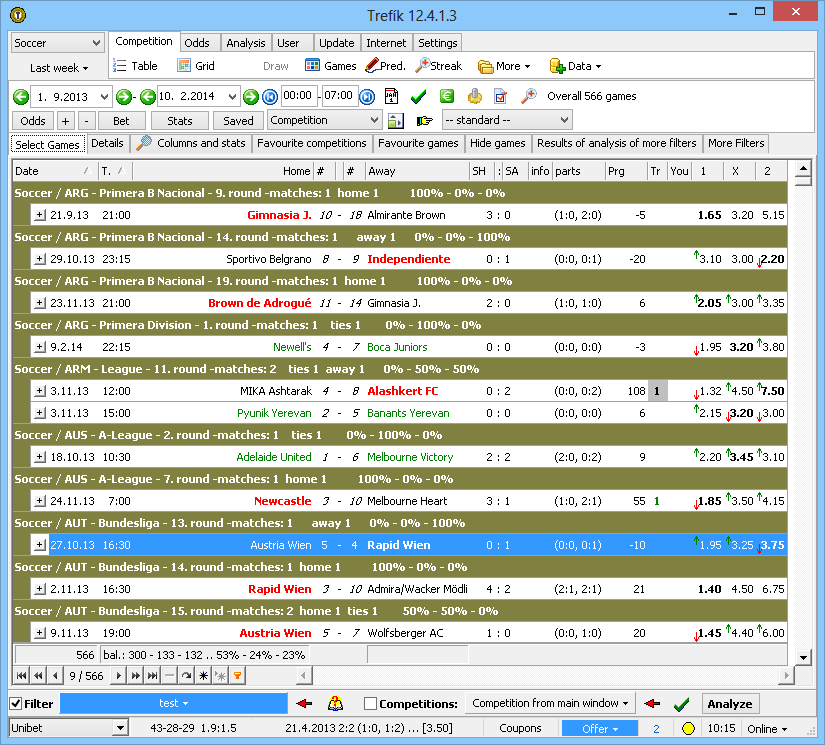
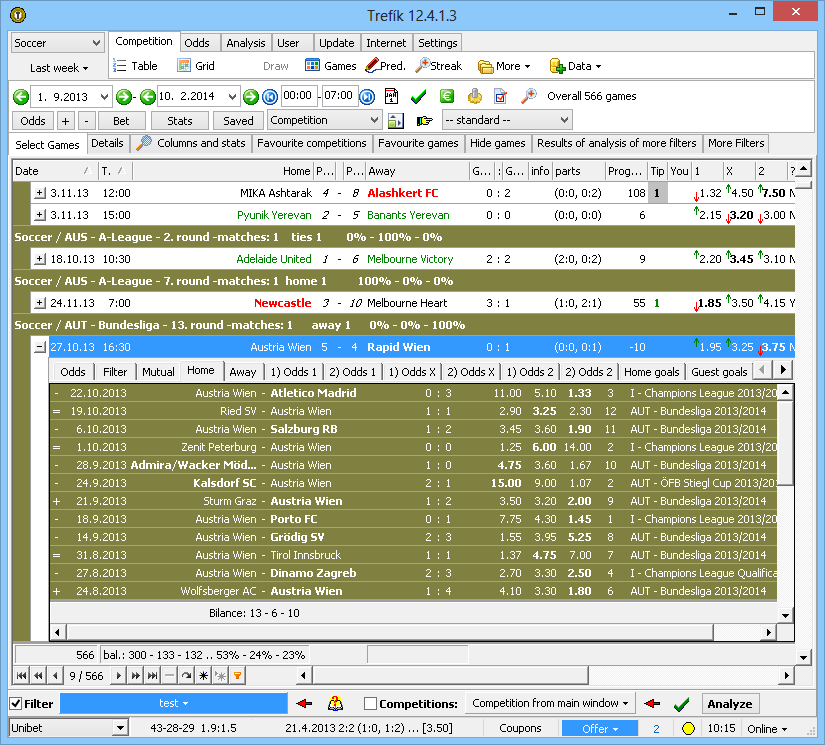
We can check directly at the Offer window that the home team really had 4 no wins during recent 5 home matches. We can click the left button "+" at the left side of each row. Several sections with match details appear. The section HOME shows the recent home team matches:
Now we have to analyse the found matches in order to find if there is any possible profit when betting the home win (as the filter defitions thesis says the home team should win now).
To analyse the situation we can use the function Stats / Charts (the button Stats is placed at the top left part above the list of matches). We can get the picture comparing the values from the window Offer. The simplest situation is the pie chart to see the results frequency:
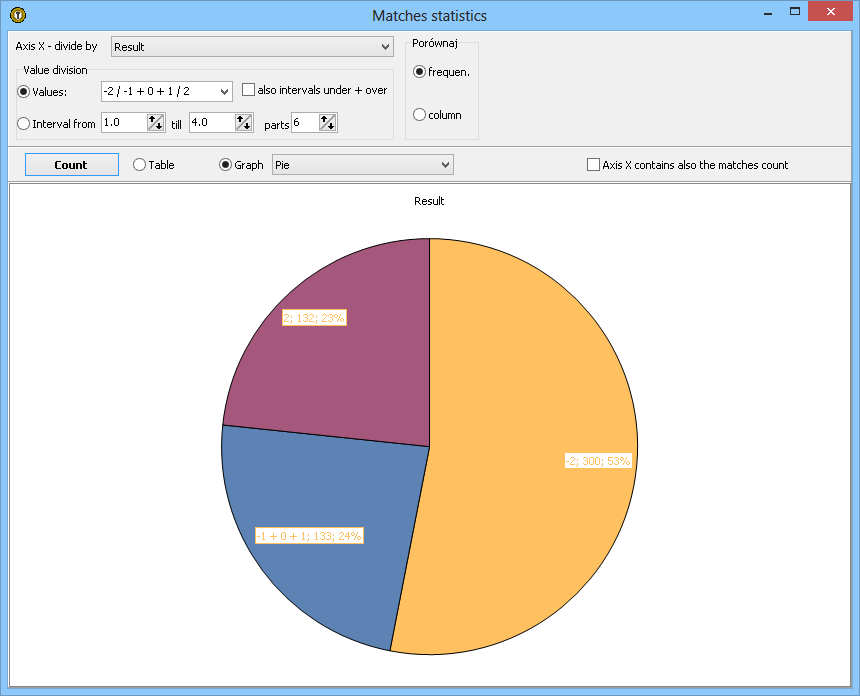
This chart shows the results as numbers (in order to be able to easily work with them - when creating new columns, ...). "-2" means the home team win, "-1" means the home team overtime win, "0" = the tie, "1" = the guest team overtime win and "2" means the guest team win. The picture shows the analysis with the results -1, 0, 1 taken into just one series (counting the matches with a tie after the regular time as a tie, no matter if a team won after the overtime).
The numbers at the pie chart shows: the result; the number of matches with that result; the frequency in percents of this result among all analysed matches.
Probably a more interesting analysis will be comparing the odds for home win and the match result. There is another feature at this window: comparing two columns values.
We will compare the home win odds as we wish to bet for the home team victory. Let's divide the home team odds for 6 intervals from 1.00 till 4.00.
The other column to compare will be the result. We will check the already described values "-2 / -1 + 0 + 1 / 2". We can use the "Stacked Column" chart with "100% level" to see the results frequency:
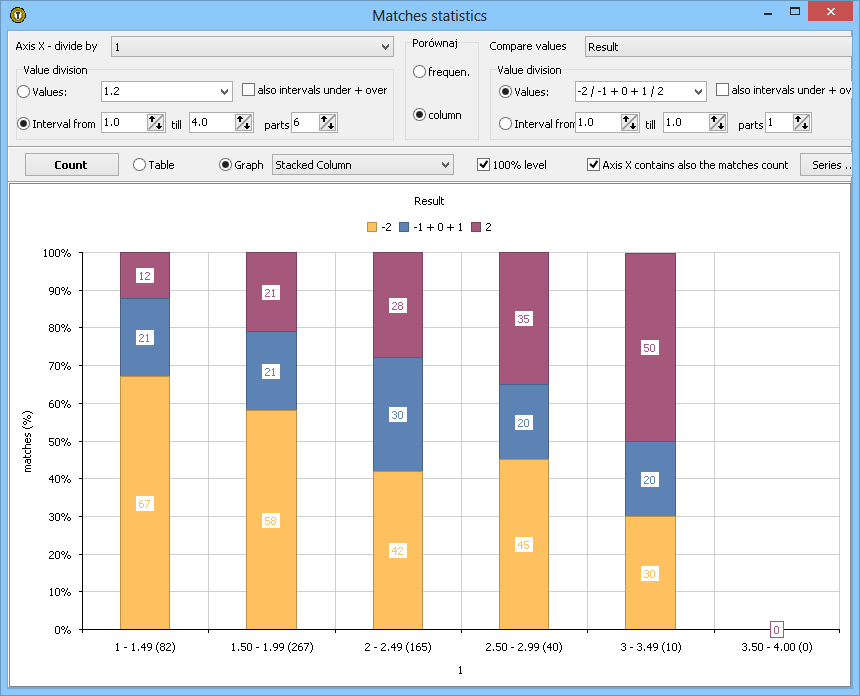
The bottom axes (X axes) divides the home team odds into 6 intervals. Each interval has an own column with the results frequency. The interesting values are at the intervals 2 - 2.49 and 2.50 - 2.99. Because the frequency of home team wins for these odds intervals is 42% and 45%. That means it would be a good idea to check the betting profit for these matches (there are 165 + 40 matches as we can read at the X axes).
Let's filter the matches at the Offer window more. We would like to see just the matches from those two interesting intervals. We can define "fast filter" for the home team odds column. Just click this column heading and define the condition for the values. We can define to see just the matches with odds 2.2 - 3.0 for the home team win:
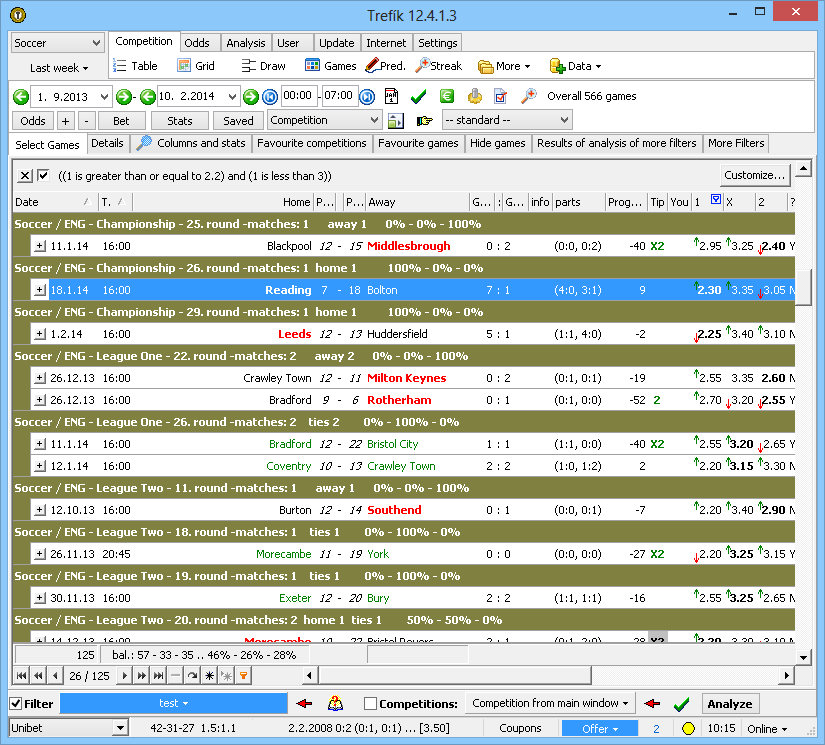
We have 125 matches now with 57 home wins, 33 ties and 35 guest wins. All of them have the home team win odds at the interval 2.2 - 3.0 and all of them have the home team with 4 no wins from the 5 recent home matches + (2 other condititons from the filter definition).
To get the betting profit analysis we can use the feature Stats / Profit:
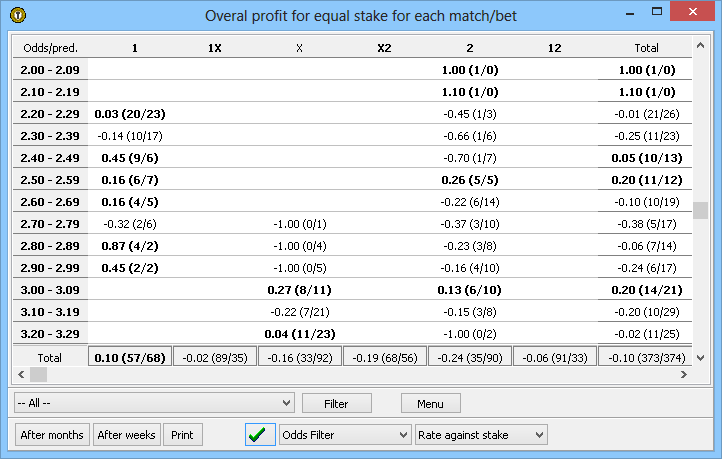
This window shows the betting efficiency of bets for all available odds for all matches from the window Offer. The columns contain the predictions for bets. The rows contain the odds intervals.
If there is any bet with the odds from that interval then the table cell contains the information if that bet would be winning or loosing. Every match can be included into all columns at once (if there are available odds for all possible match bets).
The cell values shows the winning stake rate and the numbers of winning / loosing bets (you can see also other values if changing the selected value at the right bottom combo box).
For example the value "0.03 (20/23)" at the row "2.20 - 2,29" and the column "1" informs that if we bet all matches with odds from the interval 2.20 - 2.29 for the home team win then the bet would be winning 20 times and loosing 23 times. It means that the overall PROFIT would be just 3 percents from the overall stake (43 bets would be used).
The footer row of the column "1" contains the value "0.10 (57/68)". It means that the overall profit would be 10% if betting the home team wins for all matches with odds from the interval 2.20 - 2.99 (57 winning bets + 68 loosing bets).
The filter definition above is just a sample of creating and checking a simple betting strategy (although it would not be so simple to use it without Trefik). It would be possible to activate many other conditions and test if the filter winning profit could be higher. It would be also possible to check the strategy results at more past seasons - but is is not a task for this page. You can test it in Trefik yourself.
As we have a tested betting strategy then we can use it for the future matches. It is enough just to select the current dates and Trefik finds the current matches which meet the defined filter conditions.
Generally we can say Trefik brings really a lot of possibilities how to analyse the matches, how to create the betting strategies. The user can test everything at the past seasons and then apply for the current matches. The Trefik user can create the betting strategy, it is his "know-how". Trefik is just a tool for easy applying this user "know-how".