Periods in ice hockey - goals scored
A quick comparison of the number of goals scored for both teams after periods
In Trefík in the Offer window, we can display various statistics for the current offer. On this page, we will show the display of the average goals scored in hockey by individual periods in the last 10 games.
We will create a simple filter and use the Balance section. For the home team, we will be interested in goals scored in third periods in home matches. For guests, on the other hand, goals in away matches.
Goals scored are included in the subsection Stats Team. The received goals, if we would like to use them, are monitored in the Stats Opponent section. And the sum of scored goals (or corners, shots - whatever is specified in the section settings) is provided by the Stats Total section.
Each section of Team / Opponent / Total Stats is available in three separate versions. It is thus possible to set three different criteria for each monitored statistic. We will use this to track the number of goals scored in all three quarters separately.
The created filter will look like this:
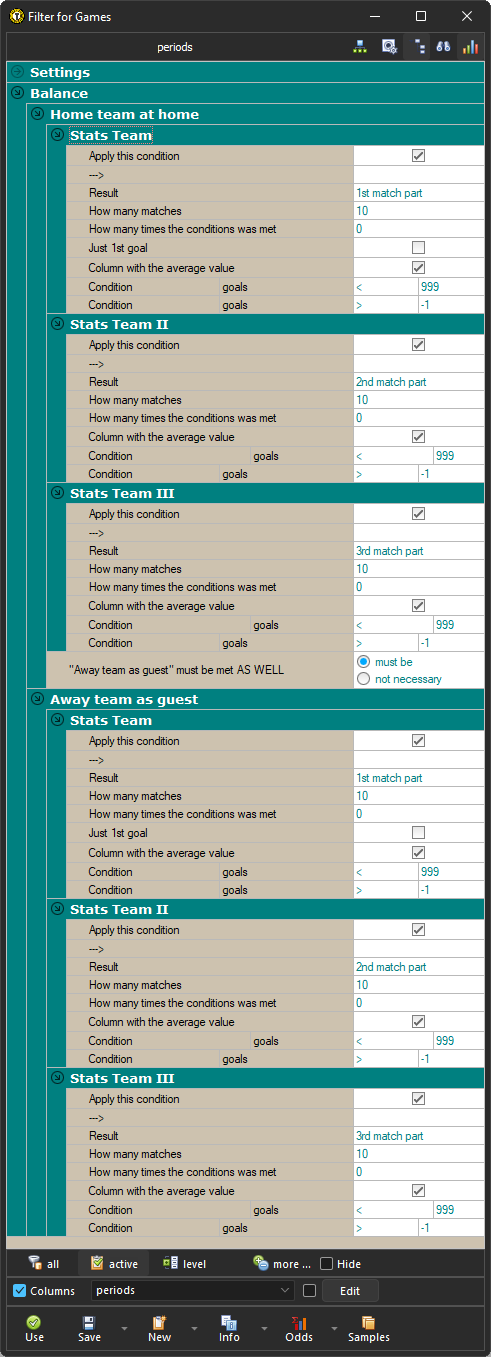
.. so in each of the three Stats Team sections for Home at home and Guests away one is selected in the item Result part of the match (= in hockey it is a third, in football it would be a half, in basketball a quarter, in tennis and volleyball a set, ...).
The last 10 matches are always examined - determined in the item How many matches. The Number of times the condition was met value is always zero. If we set a higher value, then the fulfillment of the following conditions for the number of goals would be examined. But that's not the case with this example. Here we just want to return the Column with the average value and display it in the Offer window.
At the bottom of the Filter window, use the more ... button to display the Columns item - this allows you to set which columns will be visible in the Offer window. The Edit button brings up this window:
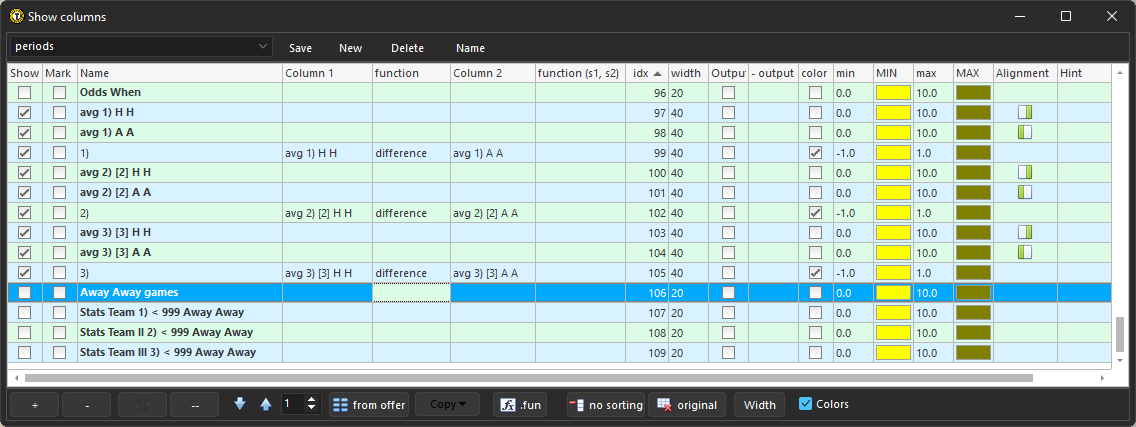
In the Name column, the labeling of the individual columns is the same as in the Offer window. Columns named in bold are derived from the current condition settings in the filter. In the picture, the values avg 1) H H, avg 1) A A correspond to the average values of the goals scored according to the settings of the individual filter sections: 1) H H captures the 1st period and previous home matches Home team, ..
In the Columns window, we can create new columns by calculating from other columns. This is exactly how the differences in the average number of goals scored by the home team at home and away from home in individual periods are created. The difference function is always used and is applied to the values specified in Column 1 and Column 2.
For a clearer display, the newly defined columns are colored differently, where the color depends on the value of the column (determined by the MIN and MAX items).
Using the filter in the Offer window for NHL looks like this:
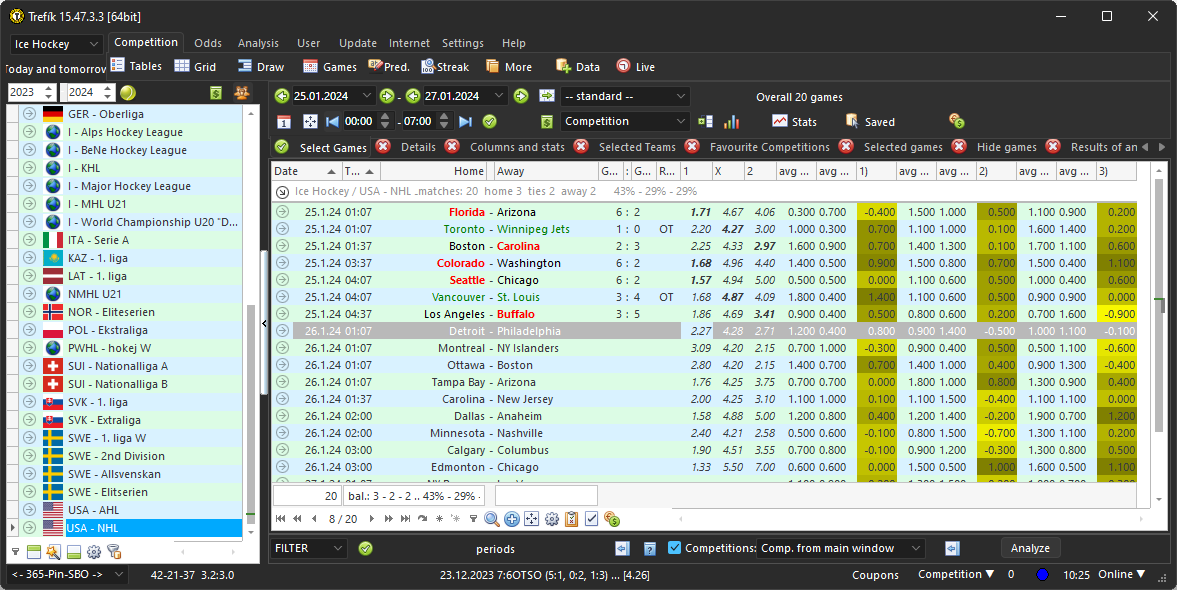
.. exactly according to the definition in the Columns section, the odds for the match always show the averages of home and away teams in individual thirds from matches at home, respectively away for guests. The differences between the two values are then highlighted in color. If the difference is positive, then the home team has a better average number of goals scored in the given period. If the difference is negative, then on the contrary, in the last 10 matches the guests have scored more goals away than the home team at home.
So much for a simple example to compare the statistics of scored goals in hockey periods. According to the color-coded columns, we can sort the displayed matches, or further filter them, work with the odds on the results of thirds, ...