Tennis statistics in the Offer window
Detailed match statistics from previous matches
In the Offer window, it is possible to display data from detailed match statistics for matches (upcoming and played). In tennis, it is possible to work with success on the serve (distinguishing the first and second serve) and on the return (again, the first and second return can be distinguished). For the analyzed matches, we can use the filters in the Offer window to display the average values of the entered values for the selected period.
The "Dominance Ratio" value appears in Trefík. It is the ratio of the ratio of balls won to the return and the ratio of balls lost to the serve. We can show the calculation of this value by working with match statistics of serve and return.
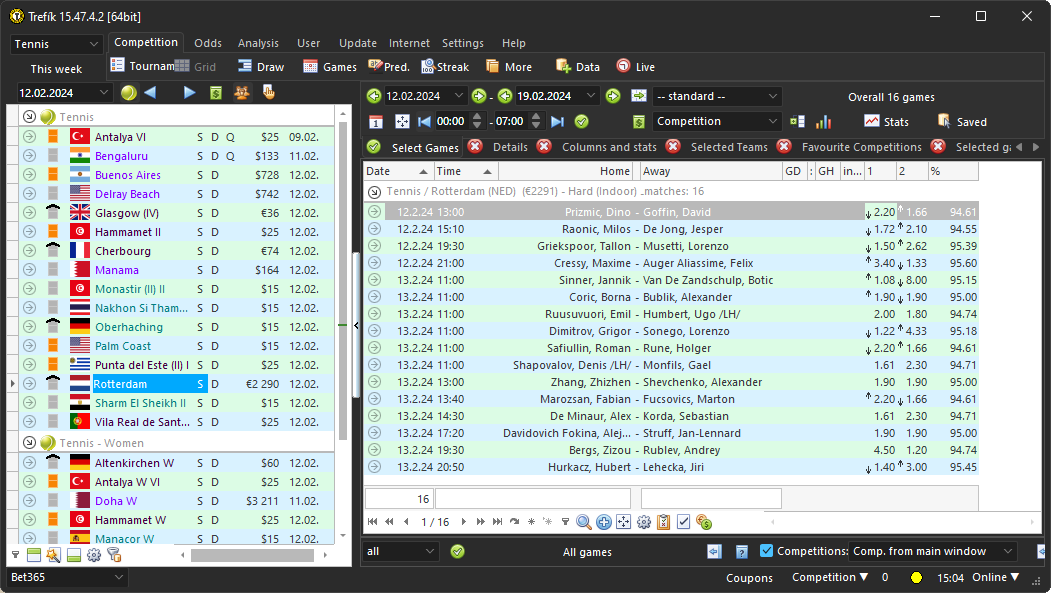
The following image shows the matches of the selected tournament with bet365 odds (at the bottom right, the Competition appearance mode is selected, i.e. the displayed matches refer to the competition activated in the left list: the main singles tournament in Rotterdam is selected in the list; at the bottom left, the display of bet365 odds is selected):

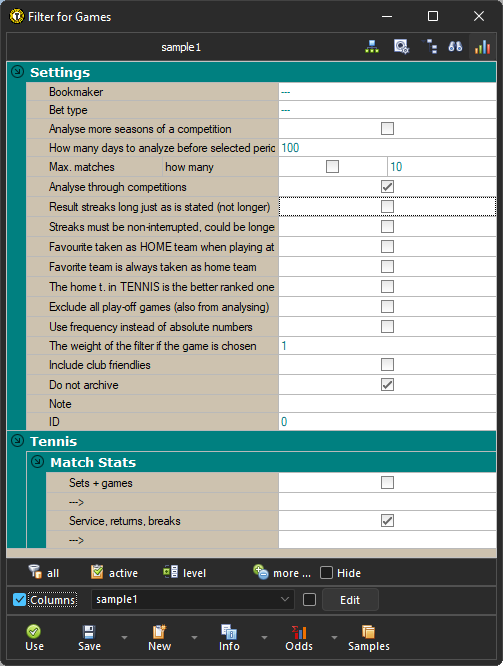
In order for match statistics to be available, it is necessary to use the filter for the Offer window and activate the appropriate Tennis / Match Statistics section in it:

.. further, the filter definition is just set to count match data from the last 100 days across all competitions.
After activating the Tennis / Match Statistics section, values with individual match statistics will be available in the Filter / Column. For example, a column labeled "T1St 1 Serv +": Tennis Player 1, Stats, 1st Serve, Point Won. Or "T2St 2Serv Tot" column: Player 2, Stats, 2nd Serve, Total.
The availability of statistics can be used to calculate the "Dominance Ratio" for both tennis players. In this demo it will be done only for the first tennis player.
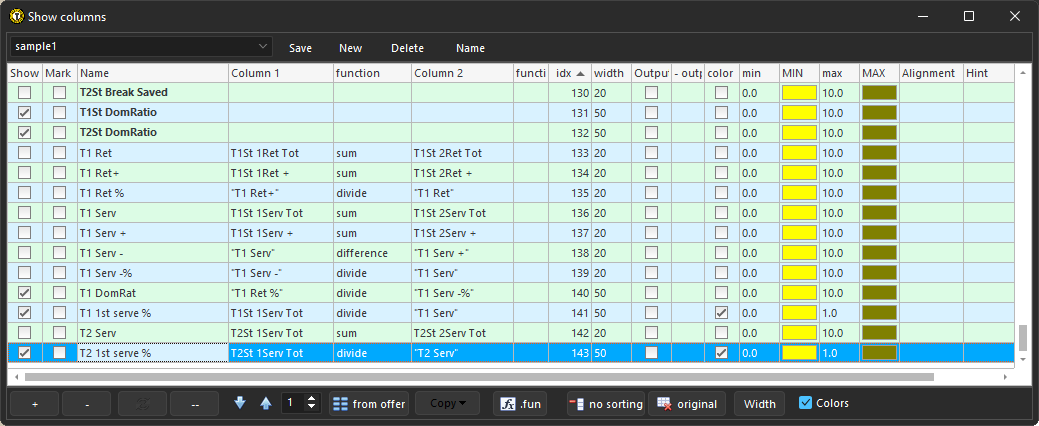
For this, we will need the ratio of the number of points earned on the return and the total number of returns. In the statistics, data on returns are divided into first and second returns. So the first step will be to create the total number of both returns and the total number of points earned for both returns. For this, we create new columns, where we add the relevant data for the first and second returns:

.. so these are two new columns containing the sums of the number of first and second returns and the sums of points in the first and second returns for the first tennis player.
Furthermore, we will create a column capturing the ratio of balls obtained during the return and the total number of returns. So the share of the two new columns created a while ago:

Next, we will calculate (that is, we will create a column with this value) the ratio of lost balls when serving. Again, we add the number of first and second submissions. The statistics do not show the number of balls lost, but the number of balls won. But we get the lost balls simply by subtracting the balls won from the total number of serves:

We calculate the "Dominance Ratio" as the ratio of the two newly created columns:

and subsequently we will be able to verify in the Offer window whether the calculated values are identical to the directly returned "Dominance Ratio" value in this column:

The given example therefore serves as an illustration of performing calculations in the Filter / Columns section. And as an explanation how the "Dominance Ratio" value is calculated.
Furthermore, in this sample filter, the percentage success rate of the player's first serve is calculated. This value is equal to the ratio of the number of first submissions to the total number of submissions. So the new column will have this definition:

.. in addition to the definition of the share, the figure also specifies that the values of this column should be distinguished by color. The minimum and maximum of this value and the color corresponding to the minimum and maximum value are determined.
The complete filter will also include a calculation of the percentage success of the second player's first serve:

Using the created filter in the Offer window:

.. from the values in the picture, it can be seen that the "Dominance Ratio" calculation for the first tennis returns identical values, which are returned directly from the filter column.
For each match, the first serve success in the last 100 days for both players is highlighted in color.
With this filter, you can also work with played matches and monitor the influence of the "Dominance Ratio" and the success of the first serve on the outcome of the match. The match statistics are always taken to the state BEFORE the match, and the displayed values are therefore the same before and after the match is played.
With the mentioned procedure, it is possible to find such matches where the monitored quantities acquire interesting values. For this, odds can be taken into account and matches can be selected..
The "Dominance Ratio" statistic is also available in the Tips: Matches / Details window .. even there it is possible to display the value for all matches and always both opponents.