Offer / Filter
Charts at the Offer window
The Offer window allows showing the charts for the visible matches. The charts use the same grouping which is active at the matches list.
To illustrate this feature we can create an easy filter. It will contain just the active section Filter / Shape and it will return the column with the home team results at home and the away team results as guests:
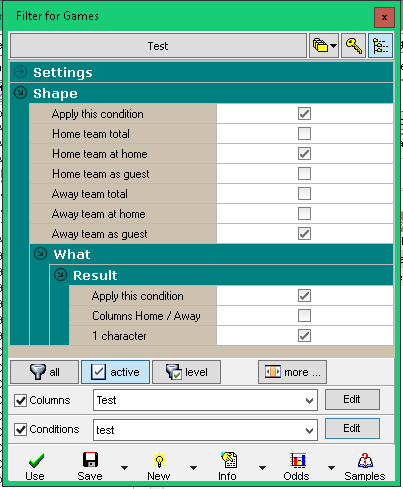
In order we could work with the values returned by the filter we need to activate the section Filter / Columns using the button EDIT:
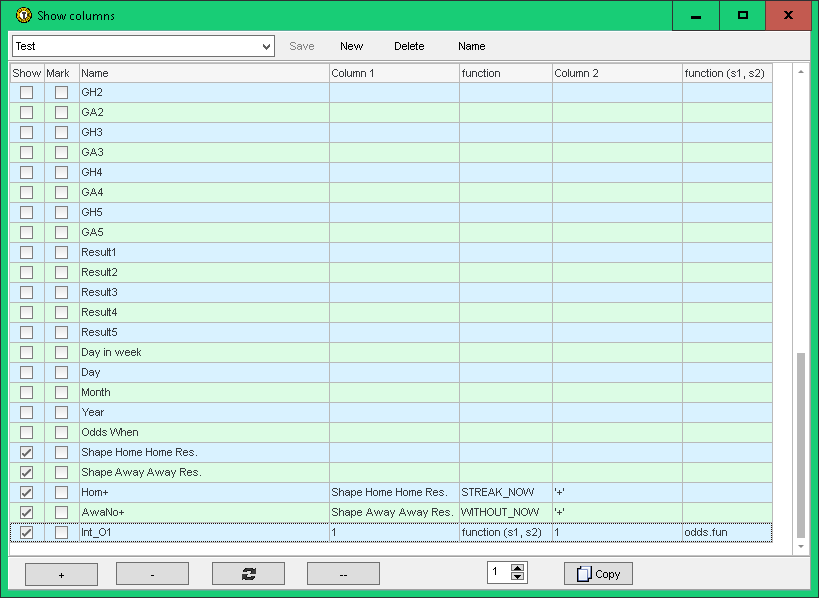
.. the columns "Shape Home Home Res." and "Shape Away Away Res." are activated: there will be returned the characters + / = / - according to the recent team results.
Using the button + at the left bottom are created also 3 more user-defined columns:
- Hom+ .. uses the function STREAK_NOW and searches for the character + at the recent home team matches. Returns the current home team winning streak,
- AwaNo+ .. thanks to the function WITHOUT_NOW looks for the character + at the away team recent matches. It returns the current number of matches without winning,
- Int_O1 .. uses the function (s1, s2) and the externally defined file odds.fun. This function compares the values at both selected column (the both parameters can just one column as at our sample - we compare just the odds for the home team victory, the column 1). The file odds.fun is necessary to create at the Trefik / Filters folder with this content:
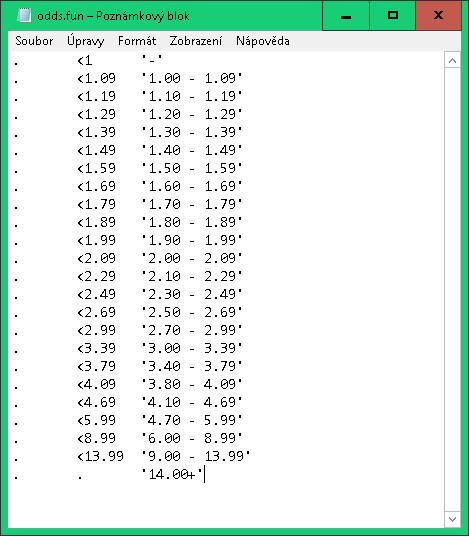
.. the file contains three columns divided by TAB. The first column contain just the dot which means this column is ignored this time. The second column contains the comparing formula and the third column contains the returned value. We have the third column values at the single paragraphs which defines the outpit text value. When using the defined FUN file it is started at the first row and finished at the row where the comparing is met. Our file is created to return the information about the odds intervals.
Also the Filter / Condition section is used:
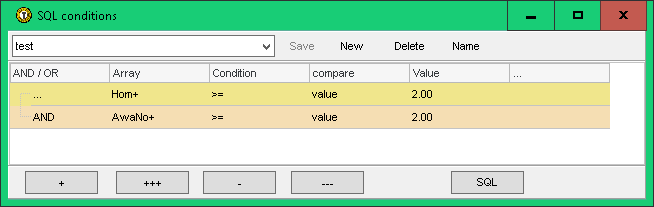
.. defines that the home team home matches winning streak must long at least two matches. And also the away team guest matches not winning streak must long at least two matches. These conditions are defined just as a sample not as any $$$ profit idea.
When using the created filter for the football matches for the dates 1.5.2017 - 20.8.2017 and bet365 odds we would get the following list of matches:
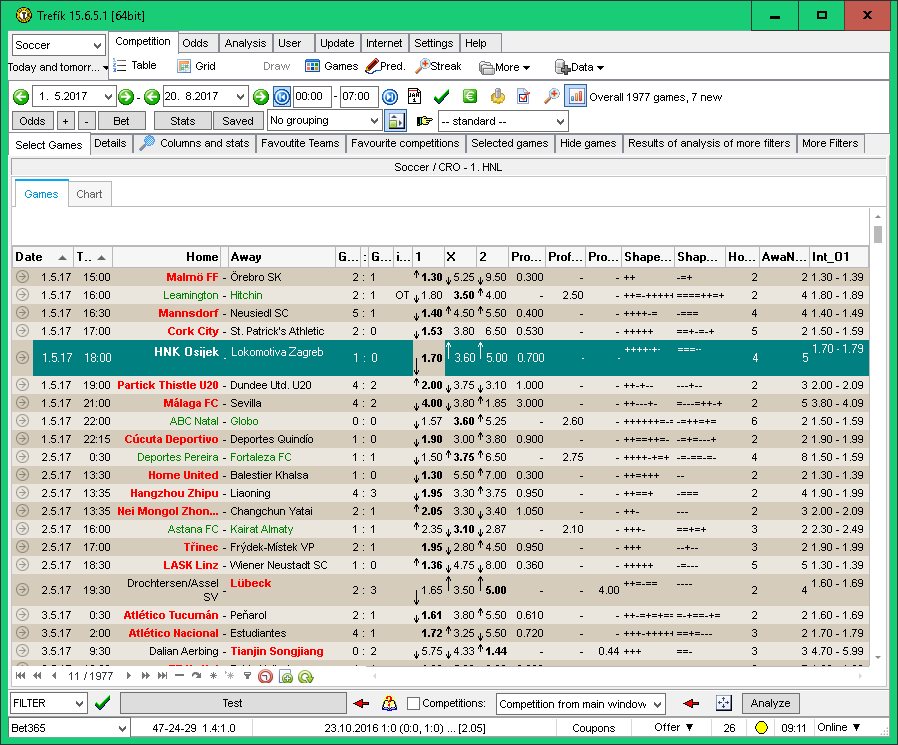
.. at the picture there is visible the area for definition of the grouping. This can be activated by the button at the right from the fast option area for grouping changes (right to the caption No grouping at our picture).
.. also please notice that the section Charts is active at the top of the matches. This section can be activated by the button at the top left to the caption with the number of visible matches.
We can group the visible matches using the selected column. We can start with our created column Int_O1 which contains the odds intervals. The matches should be grouped by the odds for the home team victory then as defined at the file Trefik/Filters/odds.fun.
The grouping can be done by drag and drop the column heading. We should click at the heading of the Int_O1 column and move it to the grouping area. The result should look like this:
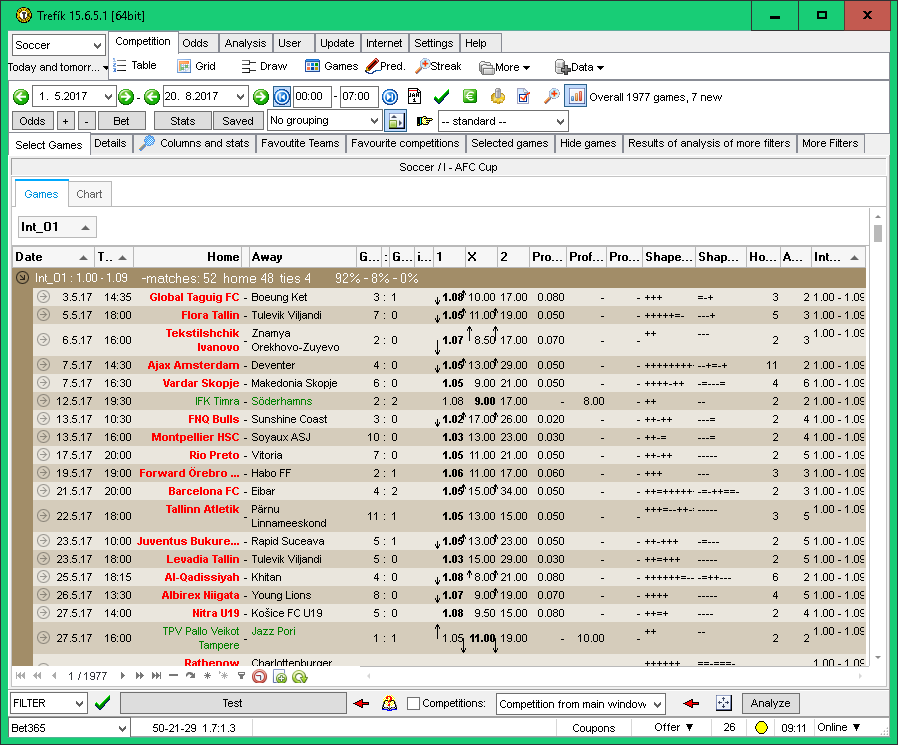
.. the matches are grouped by the odds for home team victory.
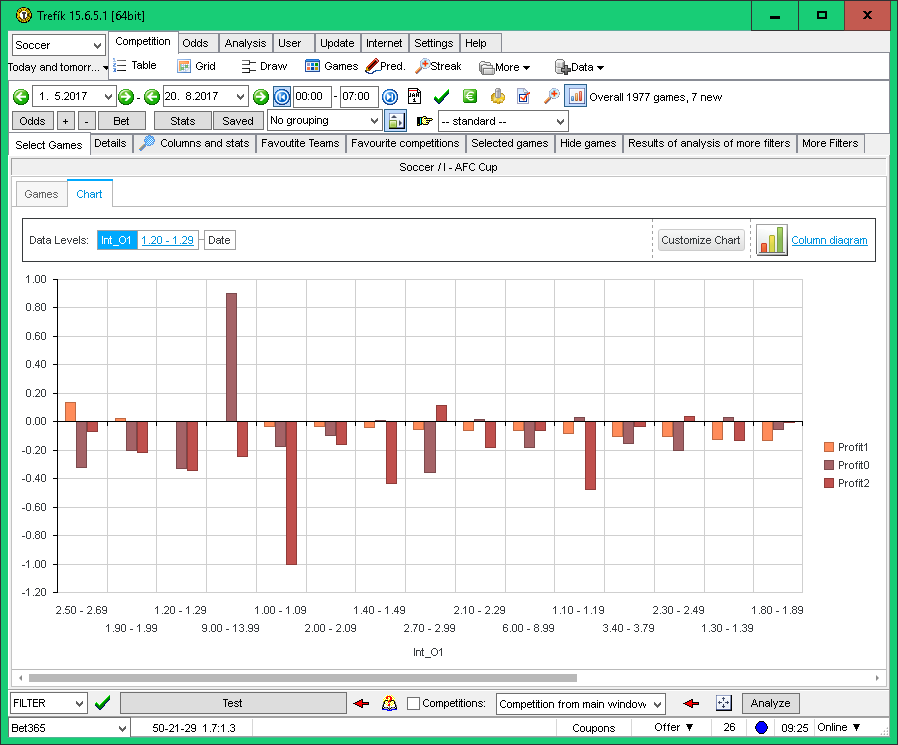
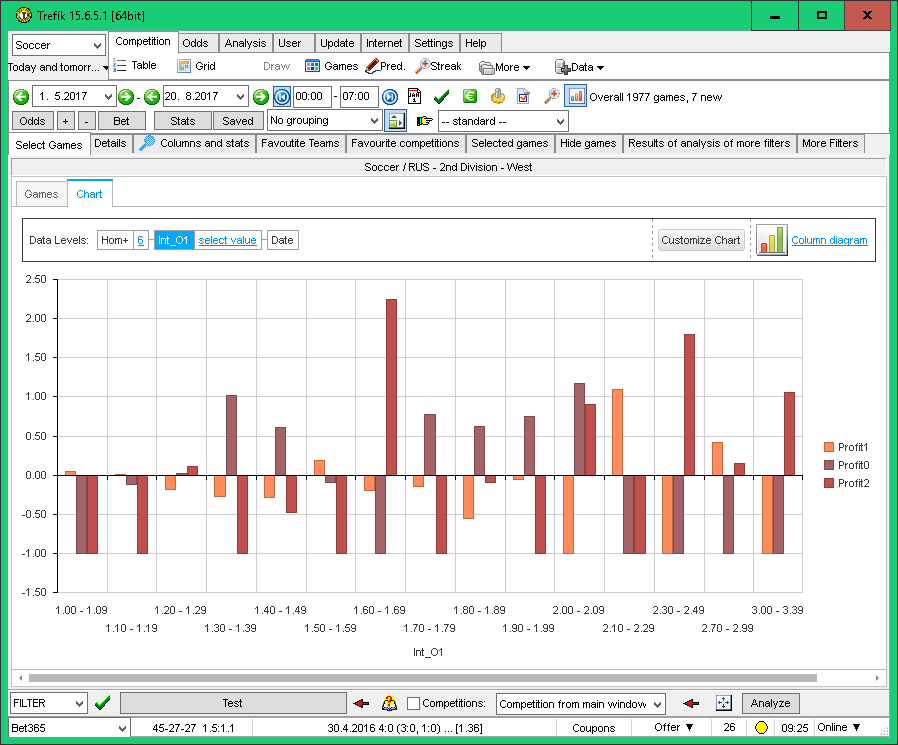
By clicking the section Charts (at top left to the matches) we get:
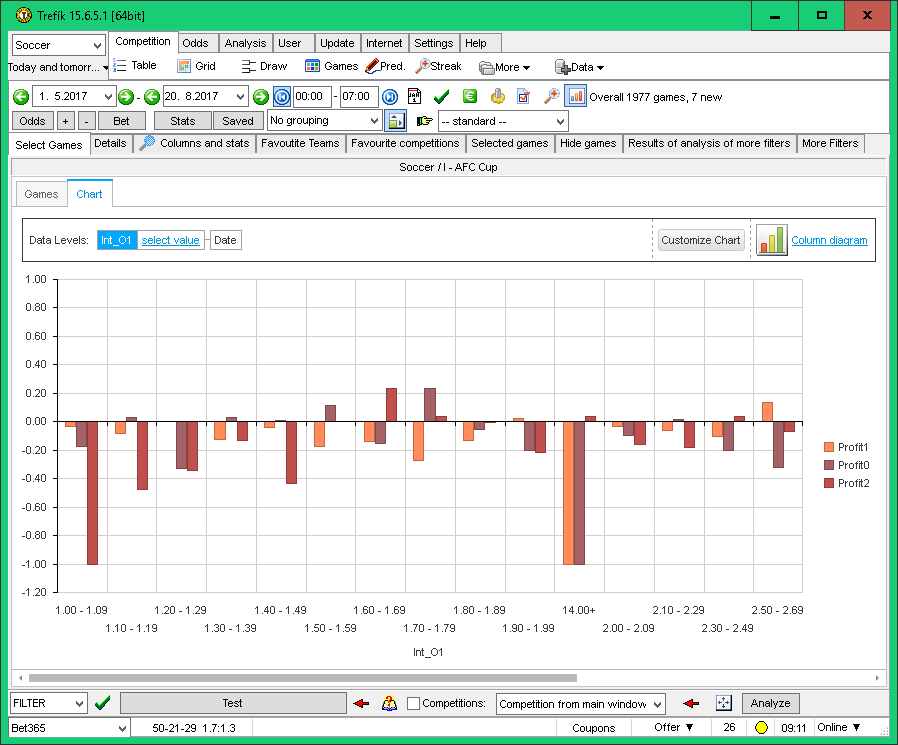
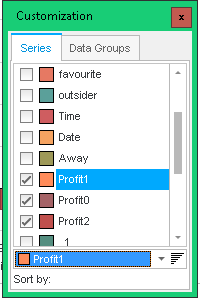
.. the chart options can be changed by the button CUSTOMIZE CHART. We can select the column which should be visible. The picture shows the column with profit for 1 / X / 2 (these columns must be activated at the Filter / Columns area). We can see that the Profit1 is positive only for the odds intervals with the limit 2.50 - 2.69.
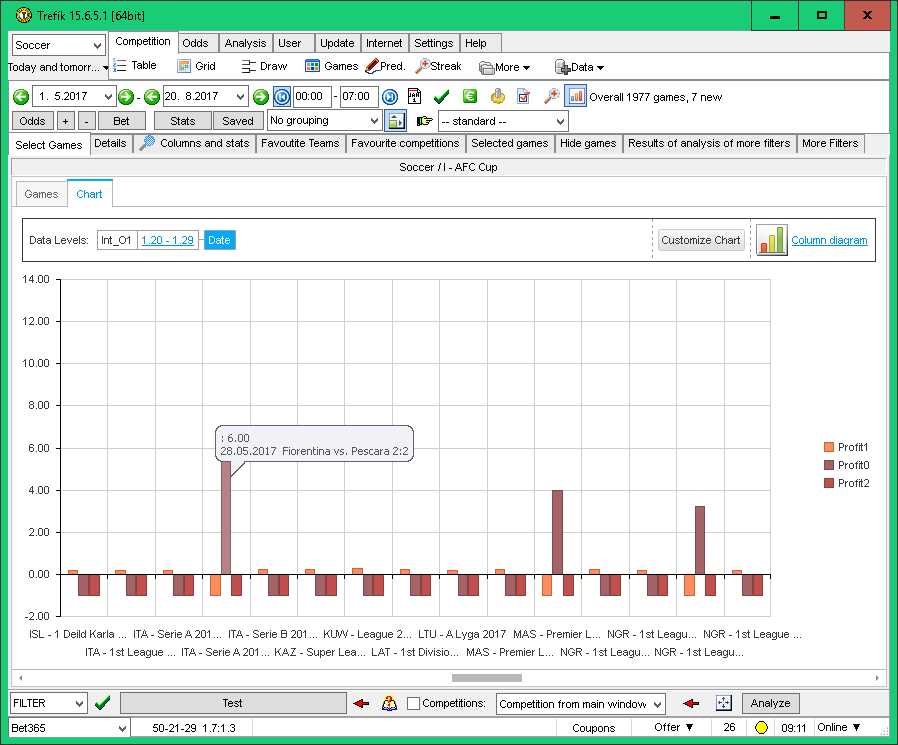
By clicking a selected column the details are displayed The next picture shows the matches after activating the odds interval 1.20 - 1.29:
The button CUSTOMIZE CHART allows also defining the values order. This is how to order the values accoring to Profit1 values:
.. and the result would look like this:
.. the odds intervals are ordered from those with the highest Profit1 value. Ordering by a summary value can be set also directly at the list of matches: using the right mouse button at a group heading - there is a menu and you can select the order summary option.
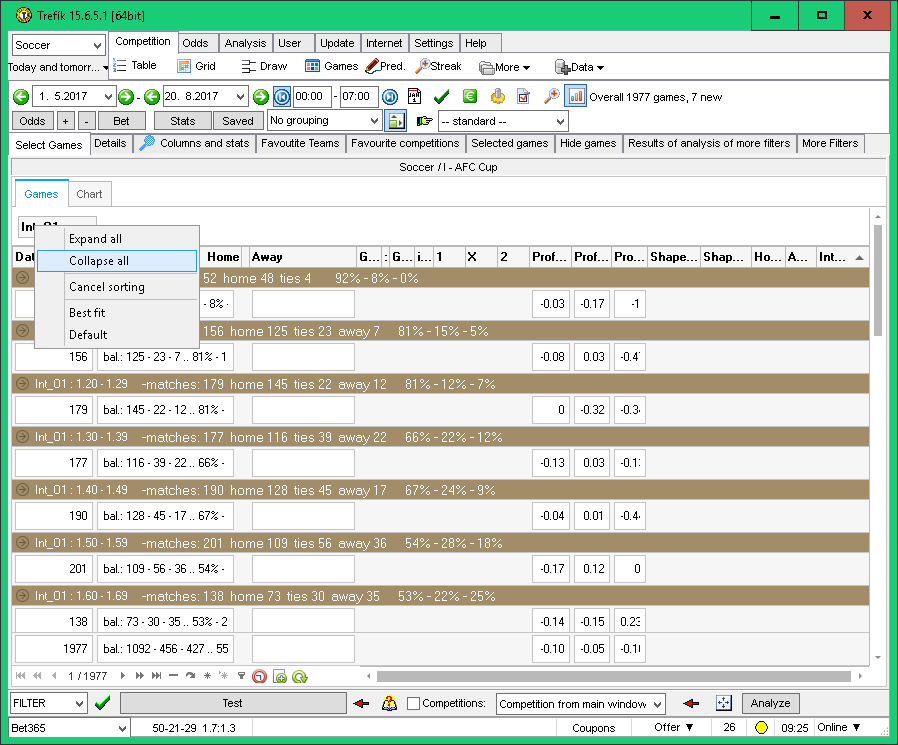
We can display at the Offer window just the summary values from all matches groups. To make it just click the right mouse button at the field with active grouping and select Collapse all:
We can change the grouping by drag and drop at the other columns headers. The changed grouping is automatically activated also at the Chart section. The next picture corresponds to the situation when the grouping by two columns is activated: the column Hom+ (the current home team winning streak) and Int_O1 (odds 1 intervals values):
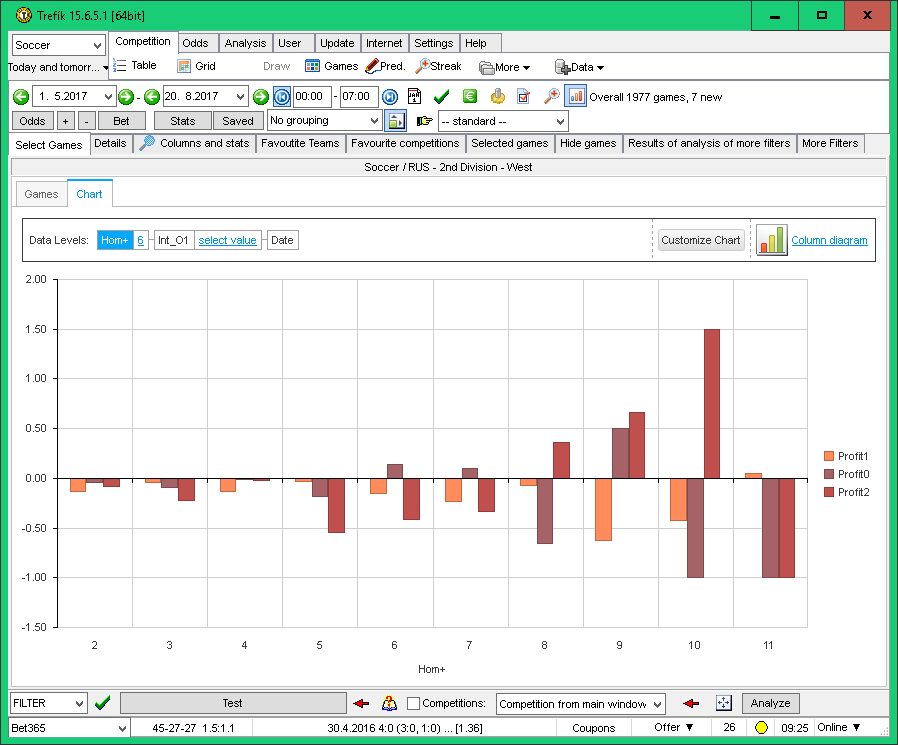
When clicking at a value at the chart the details of the next grouping level are displayed. The next picture should the Profit1 after selecting the value 6 at the column Hom+ (which is stated at the top of the chart area):
The described steps shows how to display match data at charts and analyze the values intervals and group the matches, ...